Douglas
L. Wilson is the team leader on this project.
Doug is a student pilot and has logged over 65 hours in Cessna 172
aircraft. His familiarity with the
aircraft made him a logical choice for leader of the team. In addition to being the team leader, Doug
serves as Chief Test Pilot for the project.
Abraham
Gutierrez is the Chief Systems Engineer of the project. Abraham has undertaken the task of
understanding the phugoid mode. This
includes learning the mathematical models associated with the phugoid
mode. Abraham has concentrated his
efforts on the Matlab coding that will be used in the phugoid analysis.
Anh
Huy Nguyen is the Chief Flight Engineer for the team. Anh Huy has studied the Cessna crash and
probable causes of the accident. In
addition to this duty, Anh Huy has been instrumental to the team by completing
the report from The Design of Everyday
Things. His report on how this
applies to this information applies to this project immediately follows this
section.
These
are the designated roles for each team member.
Additional tasks such as the writing of the weekly memos are written by
each member on a rotating basis.
In Donald A.
Norman’s book, The Design of Everyday
Things, he discusses the importance of creating guidelines for everyday
objects for the use of consumers. Items
like door handles, stove tops, and light switches must be designed to maximize
consumer efficiency. Early forms of
products often overlook the user’s necessity of basic instruction. For example, doors should be designed so that
people can automatically locate where the door opens – by either pulling or
pushing the door. If people are even a
little confused about the door’s orientation, then its design is deemed
faulty. Similarly, clear instructions
should be made on the layout of the knobs of stove tops. Distinctions of the knobs should be made to
correspond to the placement of the stove.
Some aspects of
this project relate to the design principles of The Design of Everyday Things. Companies like Cessna and Mooney must take
into account all design errors to ensure safety and efficiency for its
consumers. In case of emergencies, the
aircraft must be supplied with adequate safety features. For the pilot of the aircraft, the locations
of these objects must be within reach.
Similar measures have to be made for passengers of the aircraft as
well. So designers of the airplanes need
to study and design the switches and levers within a natural distance from the
pilot and passengers.
To avoid confusion
for the pilot in a Cessna or a Mooney aircraft, the control panel should be
relatively simple to read. Throughout
the years, aircraft companies have streamlined the control panels of their
airplanes. They have grouped together
similar instruments on the control panel, which reduced the difficulty for
pilots reading the control panels.
Glass cockpits (as shown if Figure 1) have been designed to make viewing
all of the instruments even easier for pilots.
Even complex objects should have the ability to have simple improvements
made to them. Companies should
acknowledge mistakes and improve on them.
New Glass Cockpit from a Cessna Mustang [1]
Cessna
172 cockpit circa 1958 [2]
Figure
1–Comparison between the
new glass cockpits and the older style cockpits.
According to Norman, the instructions
which outline the steps taken during an emergency should be clearly
understood. Unnecessary words and
phrases should be left out and only a succinct description should be
included. For our case, the passengers
during a crash should be told where the exits are and what to do during an
incident.
The tasks of
completing a complicated project can be made using the principles of design
according to Norman. These are listed below.
- Use both knowledge in the world and knowledge in the
head.
- Simplify the structure of tasks.
- Make things visible:
bridge the gulfs of Execution and Evaluation.
- Get the mappings right.
- Exploit the power of constraints, both natural and
artificial.
- Design for error.
- When all else fails, standardize.
These principles have been
incorporated in the project by researching the crash investigations online and
from documents currently available. The
project has been divided into sections where each team member is responsible
for their part, but can also assists others.
The research has been applied to creating virtual models of the
aircraft, which have been modified from previous specifications of other
planes. The errors in the project will
be analyzed to determine what improvements need to be made for future
assignments [3].
On
May 5, 1998 at 9:30 a.m. (pacific), a Mooney 305 that
was owned and operated by the pilot experienced an in-flight breakup while
descending. According to the Federal Aviation Administration (FAA), the pilot
spoke with Oakland Flight Watch Personnel while he was cruising at an altitude
of 19000 feet. According to the FAA report, at 8:55 a.m. Flight Watch personnel asked the pilot if he was
aware of the forecast for icing and asked the pilot if his plane had deicing
equipment. The pilot replied that he did not have de-icing for the airplane and
asked Air Traffic Control if he could turn around and land at
Bakersfield Municipal
Airport. Air Traffic
Control gave the pilot permission to go back and land at
Bakersfield Municipal
Airport [4].
The
timeline for the Mooney 305 crash started at 8.55 a.m. when the pilot was cruising at an altitude of
19000 feet when he decided to turn around and land the airplane at Bakersfield
Municipal Airport.
As he was heading back, the pilot descended to an altitude of 15000 feet in
which he cruised there for about seven minutes due to air traffic. Air Traffic
Control cleared the pilot to descend to an altitude of 2300 feet. At about 9:29 a.m. the pilot reported to Air
Traffic Control that he was down 2300 feet, but after that report there was no
further communication between the pilot and the
Air Traffic
Control Center
[4].
According
to the report at about 9:30 am,
an eyewitness, who was at Interstate Highway 5, reported hearing the sound of
an engine at a high rpm and a loud “pop.” The eyewitness also observed debris
falling down near Interstate Highway 5; in fact, the main wreckage of the
Mooney 305 was found 330 yards east of Interstate Highway 5 [4].
According to the National
Transportation Safety Board (NTSB), during the last 24 seconds of
radar-recorded flight the airplane's rate of descent increased to 3,500 feet
per minute, and over its southerly course, its ground speed increased to 240
knots. Shortly after this at 9:30 a.m.,
emergency locator beacon was recorded in the radar control facility. The report
also indicates that the conditions in which the pilot was flying were light to
moderate turbulence and light to moderate rime/clear icing conditions.
Engineering analysis and testing by the airframe manufacturer predicted the
onset of flutter to occur at 241 knots [4].
The Mooney
Aircraft Corporation, manager of structures, examined the airplane under the
supervision of the NTSB investigators. Following a review of the observed
evidence, the company reported that its preliminary conclusion is the aircraft
may have had a failure to the horizontal stabilizers caused by flutter,
initiated after buckling of the horizontal stabilizers due to either excessive
loading above the design allowable limits or due to previous damage. Also, the
FAA airframe specialist from the Ft.
Worth, Texas,
Airplane Certification Office, examined the recovered wreckage. Furthermore,
the specialist noted the there was no indication from the structural fractures
of corrosion or fatigue failure being present. Furthermore, he also indicated
that both horizontal tail surfaces and elevators left the airplane in the air
and that the right side did a negative/positive cycle to come up and hit the
vertical tail and rudder. In the follow up from the FAA's Airplane
Certification Officer reported that the airplane lost the horizontal tail due
to some type of induced flutter caused by exceeding the never to exceed velocity
(Vne) [4].
According to the Stearman report,
significant indications of flutter were found in the wreckage. The most obvious
indication was the loss of the control mass balance weights on all of the
control surfaces. Also, the report indicated that it was quite evident from the
observations of the wreckage that all of the aerodynamic control mass-balance
weights attached to prevent flutter were torn from their supporting structures
by oscillations sufficient to destroy their supporting strength. The report also indicates that significant
indication of flutter was present but it seemed (from wreckage) that the
aircraft did not exceed the actual flutter speed of the undamaged airframe. Instead the flutter was triggered by an
overload that damaged the horizontal tail brought on by the aircraft
maneuvering in an unstable phugoid mode well above the structural cruise speed
in the presence of turbulence [5].
The report also
stated that the reading of the radar indicated that the pilot was flying below
the structure’s cruise speed and also below the never to exceed speed. The
radar also indicated that oscillations of long periods started occurring during
the descent phase of the flight. These findings are indications of phugoid mode
continuously being excited by the turbulence and gust existing in the lower
atmosphere. Furthermore, the continuous presence of the phugoid mode was a
result of a malfunction autopilot that did not account for modifications made
to the aircraft [5].
The
motivation for our analysis and design comes from the report provided for us by
Dr. Stearman in which he stated that the caused of the accident of the Mooney
305 was due to a malfunction control system during a phugoid mode oscillation.
The malfunction was due to the modification made to the airframe of the Mooney
M20k, in which 45 percent more horsepower was added in addition to an extra
propeller blade. These modifications can bee seen on Table 1. This also shows how the aircraft performance
changed.
Table
1: Mooney M20K and Mooney 305 Specifications [6].
Specifications
Mooney M20K Mooney
305
Horsepower 210 HP 305 HP
Propeller 2 blades 3 blades
Max takeoff weight 2900 lbs 3200 lbs
Max landing weight 2900 lbs 3040 lbs
Empty weight 1860 lbs 2068 lbs
Max. useful
load 1040 lbs 1132 lbs
Stall Speed 60 kts 61 kts
Service Ceiling 24000 ft 24000 ft
Max. Level Speed 198 kts 240 kts
Cruise Speed (kts) 188 kts 120
kts
Takeoff over obstacle 50ft 1500 ft 1200 ft
According to our findings the
Mooney 305 was FAA certified, meaning that the changes would not affect the
airplane’s performance. Unfortunately, the Mooney 305 was never tested to see
if the control system would respond to the new changes. The purpose of our
project is to see if, in fact, the control system failed during the Mooney 305
crash.
The phugoid mode is the simplest
oscillatory mode in aircraft dynamics; therefore, a simple mathematical model is
given to identify the phugoid mode. This
model is given below. First, it was
assumed that the thrust of the airplane was equal to the drag, so the only
effective forces acting on the aircraft are lift and gravity. Therefore, the
analysis started with the conservation of energy.
The simple
mathematical model for the phugoid mode started with the energy equation which
is shown below [7].
T+V=K, ( , V=mgh, and K=constant) (1)
The thrust of the
airplane is neglected and the mass (m) is assumed to be constant. Then the energy equation is differentiated
with respect to time, and this operation results in the following.
m( +gh)=K (2)
 =0 (3)
Another assumption
is assumed to make the analysis simpler in which the equation for the lift
coefficient (Cl), density ( ) and the platform area (S) are assumed to be constant.
 (4)
(4)
Another equation
that is used in our mathematical approach was
Newton’s second’s law which is shown below.
F=ma (5)
F=m =L-mg (6)
 (7)
(7)
Once the
conservation of energy and Newton’s
second law are used to analyze the Mooney 305, the equations are combined to
come out with a mathematical model that governs the behavior of the airplane
with respect to height. The equation that comes out by combining Newton’s second law and
the conservation energy is shown below:
 (8)
(8)
After a model for
height is found, a mathematical model for velocity is obtained by
differentiating twice the equation of motion as shown below.
 (9)
(9)
Once this equation
is obtained, is substituted into the
equation in order to have an equation only with respect to velocity. This is shown below.
 (10)
(10)
In order to
linearize this equation, small perturbations were taken into account to make
the following equation show the approach we that was taken
to obtain the model that shows the phugoid mode.
 (11)
(11)
 (12)
(12)
 (13)
(13)
 (14)
(14)
 (15)
(15)
From these steps, a velocity model
and a height model are obtained.
 (16)
(16)
 (17)
(17)
In order to add an external force
to the equations, the formula uses a further manipulation which is shown
below.
 (F is the external force) (18)
  (19)
(19)
Once the external force is added to
the equation, the derived the model looks as it is shown below.
 (20)
(20)
 (21)
(21)
This mathematical approach is
obtained from previous studies already conducted to analyze the simple phugoid
mode. The approach outlined above is for a simple, undamped phugoid mode
oscillation occurring to an airplane. Although the mathematical model will be
modified later, it will assist us in fully understanding how a phugoid mode works.
The task will be to create a Matlab program that can demonstrate that in fact
the phugoid mode caused the accident in
Bakersfield,
California.
In order to analyze
the control system of the Mooney 305 a transfer function is being modeled using
the equations of motion of the aircraft. The simple model will consist of velocity
and acceleration inputs that will be obtained from flight simulator using the X-Plane
software. Once we obtain the inputs, the control system will consist of three
things: a vertical/directional gyro, a control servo, and an aircraft dynamics
box. The components will control the stabilization of the aircraft (also known
as the autopilot). The output expected
from the control systems are those of a Mooney 305. The task will be to produce
a control system that will stabilize an airplane during a phugoid mode.
After observing
the aircraft during the entire flight, it is important to notice the effects
the flaps have on the aircraft. The part
on the trailing edge of the wing is called a flap. During takeoff and landing the flaps were
deployed to vary the amount of force produced by the wing. The reasons for including flaps on an
aircraft design are to change the airfoil shape and increase the wing
area. Pivoting the trailing edge of the
flap downward increases the airfoil camber and lift. Also, the large aft-projected area of the
flap increases the total drag on the aircraft, which allows the airplane to
slow down during landing [8].
The main focus of
the Cessna investigation is the crash of the Cessna 172H model aircraft on August 12, 2000 in Peachtree City, Georgia. The incident occurred at 0920 eastern
daylight time at the Falcon Field airport and resulted in the fatality of the
pilot and two passengers as well as significant airplane damage. The meteorological conditions recorded that
day at 1053 eastern daylight time were clear skies and calm winds with 10 miles
of visibility.
Falcon Field
consists of just one runway, which is 5,220 feet long with a field elevation of
808 feet. The airplane model flown that
day was Griffin
Flight
School’s (Georgia) Cessna 172H, N1749F and
was last inspected on August
8, 2000 [9]. This model
consisted of a Continental Motors O-300-D, high-wing single engine with 145
horsepower. The table below was made
showing some of the specifications of the aircraft [10].
Table
2 – Cessna 172H Specifications [10]
A list of the weights and balances
of the aircraft and its passengers are shown below.
Table 3 – Weights of
Aircraft and Passengers [8]
These values conclude that the
aircraft were close to max gross weight upon takeoff.
The time of departure from the
airport was at 0915 and the airplane stayed in the traffic pattern after
takeoff. Following this, touch-and-go
landings were made on runway 31.
The picture below illustrates the
steps involved in the crash at Falcon Field.
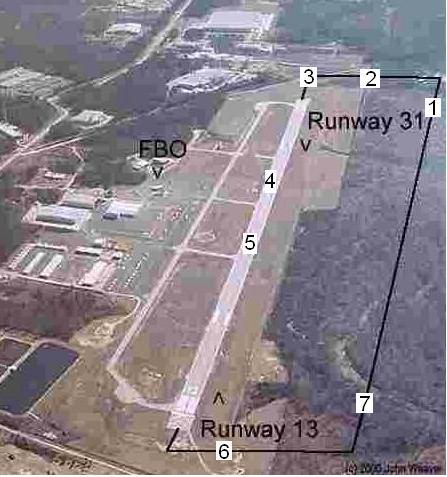
Figure 2 – Timeline of the Cessna 172H Crash [11]
The first point
shows where the pilot started his descent for a touch-and-go landing. The aircraft was at an altitude of 1000 feet
above ground level before turning downwind to the base. He was abeam to the runway and should have
been going roughly 85 knots, with 10 degree flaps, at a descent rate of 500
feet per minute (fpm). At the second
point the pilot started his final approach towards the runway, traveling at 75
knots with a descent rate of 500 fpm.
The third location illustrates where the pilot started his final
approach to the runway. The aircraft
should have used 30 and 40 degree flaps with a 3 degree glide path at 65
knots. The aircraft flared at touchdown
at point four and accelerated for takeoff up to point five. Hopefully, the flaps were raised at this
point. According to an operator witness,
the accident occurred when the pilot tried to climb out. Other witnesses mentioned that when the pilot
tried to conduct a climb, the aircraft did not gain any altitude. Point six shows that the pilot made a left
turn into the crosswind, where the aircraft should have been traveling at 550
fpm. A witness stated that the wing
appeared to be perpendicular to the ground.
However, the aircraft sustained problems and seemed to stall before
crashing at point seven [9].
A plot of the rate
of climb versus the altitude was created from values taken from the Cessna 172 and Skyhawk Owner’s Manual
and is shown below.
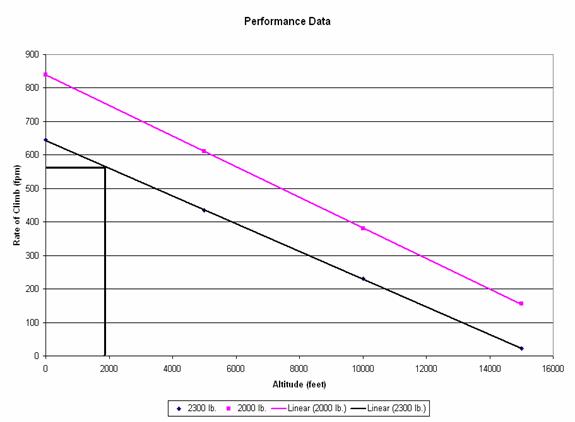
Figure 3 – Rate of Climb
vs. Altitude for Cessna Aircraft
The linear fit was
made and the top line represents the values for a 2000 pound Cessna aircraft,
while the bottom line shows the values for a 2300 pound Cessna aircraft. The extracted point shows the maximum values
that could be obtained for ideal conditions.
The rate of climb is approximately 575 fpm and the density altitude is
slightly less than 2000 feet [10].
According to NTSB
reports of the incident, the crash site was located approximately 300 yards
southwest from the end of runway 31. The
airplane remained in a nose-down position and its nose and engine was
“displaced aft into the cabin area.”
Further examination indicated that the wings received chord-wise crush
damage aft to the wing forward spars, the left door was disconnected to the
fuselage, and a propeller blade was bent and scratched. Also the tail was separated at the bulkhead
of the frame. However, no component
failures or mechanical malfunctions of the engine assembly were
discovered. The flap actuator of the
airplane was working correctly while the flap settings of the trailing edge
wing were placed at 40 degrees. In
contrast, the manufacturer suggests that flaps settings be set at 0 degrees for
takeoff. The examination of the crash
reported that the debris was littered locally around the plane [9].
Outside
investigation indicated that upon impact, the tachometer showed a 1500 RPM
reading. If this was the correct engine
output, the aircraft would not be able to maintain a climb attitude.
The results from
the crash investigations led to two conclusions of the causes of the crash of
the Cessna 172H aircraft. Either the
pilot tried to perform a touch-and-go landing and left the flaps down at 40
degrees, or the engine malfunctioned during take-off that resulted in a partial
or total power loss.
This
section of the report discusses the actual flight testing of a Cessna 172N
model aircraft. This test was performed
at the Georgetown
Municipal Airport
on February 22, 2004.
Originally
this design project was to be conducted only using flight simulators. However, the decision was made to perform
flight testing with an actual Cessna 172 aircraft. The reason for performing the test was to
gain actual flight performance data on the Cessna 172. This data could then be used to compare
against simulated data.
For
the purposes of our investigation, we wished to select a test site that
accurately depicted the Peachtree City Falcon Field Airport (KFFC). Falcon Field is a class E airport. This means that the aircraft using this airport
communicate with each other using a common frequency rather than with a control
tower. Falcon Field has a field elevation
of 808 feet mean sea level. The
dimensions of the runway are 5220 feet long by 100 feet wide and is made of
asphalt [12].
We
consulted the San Antonio Sectional Aeronautical Chart and searched for a
suitable airport near Austin,
Texas that we may use for
testing. Georgetown Municipal Airport
(KGTU) appeared to be the most logical choice as a test site. The airport has a field elevation of 790 feet
mean sea level. Additionally, Georgetown
Municipal Airport
is a class E airport. The dimensions of
the primary runway are 5000 feet long by 100 feet wide, and the runway is made
of asphalt [12]. Because the two runways
are very similar, this site appeared to suit our needs. Table 4 shows a comparison of the fields.
Table 4 – Comparison
between Peachtree
City – Falcon Field (KFFC) and the
Georgetown Municipal
Airport (KGTU)
|
|
Falcon Field
|
Georgetown Municipal
|
|
Class of Airspace
|
E
|
E
|
|
Elevation (in feet msl)
|
808
|
790
|
|
Field Length (in feet)
|
5220
|
5000
|
|
Field Width (in feet)
|
100
|
100
|
|
Runway surface
|
Asphalt
|
Asphalt
|
After
selecting Georgetown
as our test site, we needed to inquire about the possibility of renting a
Cessna 172H model aircraft. The
Cessna Flight
School representative at Georgetown is Wright
Aviation. When we contacted them, we
were informed that they had a Cessna 172N model that we could use for the
purposes of conducting the flight tests.
The primary difference between the two models is that the 172H model has
a 145 horsepower engine while the 172N model has a 160 horsepower engine. Nevertheless, the two aircraft possess many
of the same key features. They have
essentially the same maximum gross takeoff weight, dimensions, and fuel
capacity. The other feature that was
appealing about the 172N model was that it had a 40 degree flap setting. Table 5 below illustrates the comparison
between the two aircraft. The decision
was made that the aircraft were substantially similar enough so that the flight
testing could be performed.
Table 5 – Comparison
between the Cessna 172H model and the Cessna 172N model
|
|
Cessna 172H [10]
|
Cessna 172N [13]
|
|
Max Gross Weight (in lbs)
|
2300
|
2300
|
|
Usable Fuel Capacity (in gal)
|
40
|
40
|
|
Max Flap Setting (in deg)
|
40
|
40
|
|
Engine
|
0-300
|
0-320
|
|
Engine Horsepower
|
145
|
160
|
|
Propeller Type
|
Cruise
|
Climb
|
Once
the test site and aircraft were determined, the flight test profile was
created. Douglas Wilson and Dr. Ron O.
Stearman discussed the potential flight test to be considered. The flight test was being conducted to
determine the effects that flap settings have on climb rate.
Initial
consideration was given to flight testing from takeoff with different flap
settings. Cessna only recommends takeoff
with zero degrees of flaps for takeoff in the 172N model aircraft. Furthermore, Cessna does not provide
performance charts detailing the climb performance of the aircraft for flap
settings other than zero degrees.
The
possibility exists that the Falcon Field accident may have been caused by a
takeoff with the 40 degree flap settings.
Because of this fact and the manufacturer’s recommendations, we elected
to perform our rate of climb tests at altitude rather than at ground
level. The decision to test at altitude
was reached mutually by Dr. Stearman and Douglas Wilson.
The
next issue regarding the flight test was who would pilot the test
aircraft. The test was to determine the
operational limits of the aircraft, so the decision was made to have a flight
instructor at Georgetown
fly the aircraft for the purposes of testing.
Douglas Wilson contacted Wright Aviation to verify that an instructor
could perform this test. Alan Weaver,
Douglas Wilson’s flight instructor, agreed to fly the aircraft.
The
actual test flight profile called for the rate of climb data on the
aircraft. In order to obtain the data,
the test called for the pilot to climb to a designated altitude and perform a
climb at a designated airspeed and flap setting. This profile was to be done at two different
altitudes, two different weights, five different flap settings, and four
different airspeeds. This meant 80 data
points were to be collected during the test.
In
order to provide for post flight analysis of the test, the decision was made to
video tape all phases of the testing procedure.
The plan called for a video tape to be secured in the rear passenger
area of the aircraft. This camera would
then be pointed at the instruments during the test.
Test
flight SP4-E101 was conducted at the
Georgetown
Municipal Airport
on Saturday, February 21,
2004, from 8:00am
to 2:00pm (1400Z to
2000Z). Present at the time of testing
was Alan Weaver (test pilot), Dr. Ron O. Stearman, and Douglas L. Wilson. (An explanation of the test flight numbering
scheme is found in Appendix 2 of this report.)
The
temperature at the field was measured at 61˚F by the Automated Weather
Observing System (AWOS) located at the airport.
The dew point was recorded at 48˚F.
The sky conditions were broken clouds at 800 feet AGL (above ground
level). The barometric pressure was
recorded as 30.04 in Hg (inches of mercury) adjusted for sea level. The winds were from the southeast between
four and six knots. The pressure
altitude at the field was determined to be 630 feet mean sea level.
The
aircraft used in testing was the Cessna 172N model with a registration number
of N739ZY. This aircraft is owned by the
Wright Corporation and is based at the
Georgetown Municipal
Airport. The aircraft gross has an empty weight of
1469.10 pounds. The center of gravity
for the aircraft is located at 38.97 inches.
The useful load of the aircraft is 830.90 pounds. Appendix 1 of this report shows the weight
data on this aircraft.
The
preflight checklist was performed by Alan Weaver while Dr. Stearman and Douglas
Wilson set up the video recording device.
The Cessna 172N aircraft has a fuel capacity of 43 gallons (40 gallons
usable), and the fuel tanks were full prior to takeoff for the test. The occupants for the first test were Alan
Weaver (seated in the pilot’s chair) and Douglas Wilson (located in the
co-pilot’s chair).
The
weights and balances on the aircraft were performed. From this data, the aircraft was determined
to be within its weight restrictions for flight. Table 6 below shows the determination prior
to takeoff. The center of gravity for
this aircraft at this weight qualified the aircraft for operation in the normal
category.
Table 6 –Weight determination for
the first test flight
|
|
Quantity
|
Total
Weight
|
|
Plane Empty Weight
|
1
|
1469.10 pounds
|
|
Usable Fuel (6
lbs/gal)
|
40 gallons
|
240.00 pounds
|
|
Pilot
|
1
|
190.00 pounds
|
|
Co-Pilot
|
1
|
193.00 pounds
|
|
Gear
|
1
|
10.00 pounds
|
|
TOTAL
|
|
2102.10 pounds
|
Cessna
739ZY departed Runway 18 from Georgetown
at approximately 9:20 am
(1320Z). Alan Weaver maneuvered the
aircraft to the practice area and climbed to 3000 feet msl. Flight data was collected for the climb rate
for all five flap settings at airspeeds of 60, 65, 70, and 80 knots indicated
airspeed (KIAS). For the 40 degree flap
setting the 80 KIAS airspeed was substituted by 55 KIAS due to lack of climb
performance at that airspeed and setting.
After
all of the data was collected, the aircraft returned to the
Georgetown Municipal
Airport, where the
occupants departed the aircraft. A
debriefing occurred at the Wright Aviation facilities. Following the debriefing, Alan Weaver and
Douglas Wilson return to the aircraft and proceeded to collect the second set
of data.
No
refueling occurred prior to conducting the second test. Based on gage readings
taken prior to the flight, an estimated 7.5 gallons of fuel was used during the
initial data collection period. This
would adjust the gross takeoff weight to 2057 pounds.
The
aircraft proceeded to the practice area and climbed to an altitude of 2000 feet
msl where an identical test was performed.
The aircraft returned to the field and landed without incident. The estimated loss of fuel for this set of
data collection was 45 pounds.
The
flight crew returned to the Wright aviation facilities and a debriefing
occurred with the crew and Dr. Stearman.
The decision was then made to repeat the tests at a second weight. Dr. Stearman elected to join the flight crew
as an additional passenger. He was positioned
behind the pilot in the rear passenger seat.
A weight check was performed to estimate the total weight of the
aircraft as tested. Table 7 below shows
the weight calculation.
Table 7 –Weight determination for the second tested
weight
|
|
Quantity
|
Total Weight
|
|
Plane Empty Weight
|
1
|
1469.10
pounds
|
|
Usable Fuel (6 lbs/gal)
|
25 gallons
|
150.00
pounds
|
|
Pilot
|
1
|
190.00
pounds
|
|
Co-Pilot
|
1
|
193.00
pounds
|
|
Rear Passenger
|
1
|
215.00
pounds
|
|
Gear
|
1
|
10.00
pounds
|
|
TOTAL
|
|
2227.10
pounds
|
The
aircraft was loaded, and the aircraft proceeded to Runway 18. Following takeoff, the aircraft was
maneuvered to the practice area. The aircraft climbed to an altitude of 2000
feet msl. The same series of tests as
before were conducted for this weight and altitude.
A
decision was made in the aircraft to add an additional test while at this
altitude. The test called for the pilot
to reduce the engine output to 2000 RPM.
The pilot was then instructed to determine if, at any velocity
achievable, any positive rate of climb could be obtained. This test was run with all five flap
settings. The rate of climb was noted
during this test.
At
this point, the original flight plan called for the test to be repeated at this
weight, but at a different altitude.
Because the cloud ceiling was lowering, the decision was made to take a
smaller sample of data at the 3000 foot msl altitude. Only two flap settings were tested. Data was collected for climbs at both 0 and 20
degrees of flaps. Following this data
collection, the aircraft returned to Georgetown
where Douglas Wilson landed without incident.
This
concluded flight test SP4-E101. The data
was then taken for further analysis.
The
test data collected consisted of the amount of time required for the aircraft
to climb from the starting altitude to a preset altitude (generally 200-300
feet above the starting altitude). In
order to compute the rate of climb, delta h (change in altitude) versus delta t
(change in time) was computed. The
results for the first test at 2100 pound gross takeoff weight are recorded in
Figure 4 below.
Figure 4 –Calculated
performance of the Cessna 172N as calculated from Test Flight SP4-E101
The
data for the same altitude is represented in Figure 5 below. In this figure, the gross weight of the
aircraft was increased. This figure
shows the data for the aircraft at nearly the same weight as the aircraft
involved in the accident at Falcon Field.
A
copy of the flight test sheets is contained in Appendix 3 of this report. The Appendix includes the weather
observations as well as the written documents from the rate of climb tests.
Figure 5 – Calculated performance of the Cessna 172N
as calculated from Test Flight SP4-E101 (Max Gross).
The
aircraft tested in Test Flight SP4-E101 was a 160 horsepower engine. However, the aircraft involved in the
accident had a 145 horsepower engine.
This means that a data conversion needed to be performed in order to
access the climb performance of the Cessna 172H model. This conversion was performed using the
following equation [14]:
 (22)
(22)
In this equation the RC represents
the rate of climb and ΔP represents the change in power (in horsepower)
from one engine to the other. The weight
in pounds is included in the equation as W.
By using this equation, this conversion constant can be determined in
order to estimate the performance characteristics of the Cessna 172H. This function is performed below.
 ft/min (23)
Applying this conversion to the
previous figure, the derived performance can be calculated. Figure 6 below shows the estimated
performance.
Figure 6 –Derived performance of the Cessna 172H
Figure
6 above suggests that the Cessna 172H model could not have climbed from the
runway to the altitude prior to the crash in the allotted time. Additional testing will be performed through
either actual flight tests or simulated flight tests in order to determine if
these figures are correct.
The
Flight simulation was used to recreate the aircraft flight profiles.. The flight tests
were conducted using the X-Plane software.
Tests were conducted in the Flight Simulation laboratory located in the
WRW Laboratories at the University of
Texas at Austin. The tests were conducted on the Macintosh
computer. Additional flight testing was
conducted at the house of Douglas Wilson.
In that case, test were performed using a
Hewlett Packard Pentium III laptop computer.
The flight
simulation package that was used for testing wass the
X-plane software. The simulators in WRW
210 already had this program installed and were configured so that the
corresponding control apparatuses could be used for virtual flight
testing. X-plane comes with a number of
standard aircraft, which can be adjusted or modified for a specific use. All of the aircraft react realistically
because X-plane views the structures (horizontal stabilizer, vertical
stabilizer, propeller, etc.) of an aircraft as geometric shapes that are broken
into small elements. Then, finite
element analyses are made to calculate the forces on each piece. With the forces and accelerations, velocities
and positions are determined by integration.
The velocity
vectors of the elements are determined from the linear and angular velocities,
in addition to the longitudinal, lateral, and vertical arms of the elements. To maintain the correct physics of the
models, the downwash, propwash, and induced angle of attack are also
considered. The downwash is calculated
for each coefficient of lift by considering the aspect ratio, taper ratio,
sweep of the wing, and the horizontal and vertical distance of the horizontal
stabilizer from the wing. X-plane
calculates the propwash that is required for momentum to be conserved. This is done observing the area of each
propeller, the thrust of each propeller, and the local air density. Dynamic pressures are found for all of the
elements based on temperature, air speed, altitude, wing sweep, and
propwash. Using the coefficients
determined in X-plane with the dynamic pressure, the total force of the
aircraft can be determined. From this
the linear acceleration and angular acceleration can be determined by dividing
the forces by the mass of the aircraft.
The Plane-Maker
option in X-plane was used to create all of the models of this project. Also, World-Maker was used to add the scenery
to the airports where the airplanes were flown [15].
The
data from flight test SP4-D102 was used to confirm the validity of the X-Plane
software. The flight test will be
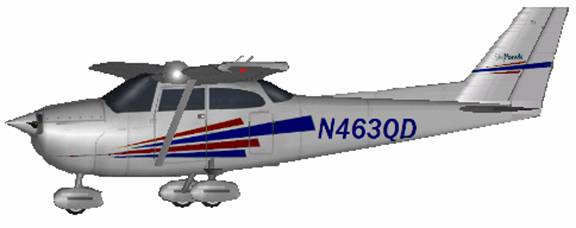
repeated using Cessna N463QE which has been created in X-Plane. This aircraft is a Cessna 172N model which
will be used primarily for the verification flights.
The
validation phase of the simulation is vital to the design project. The simulator must be able to reproduce
actual flight if the team is to analyze aircraft design and performance. Without this task being accomplished, the
reliability of any findings this team makes will be questionable.
Following
the validation of the software, Cessna N463QD will be used to recreate the
Falcon Field accident. Tests will be
conducted to access the capabilities of climb out using 40 degrees of
flaps. Additional tests will be
performed to simulate engine failures shortly after takeoff, and we will
attempt to recreate the most probable accident scenario.
The
Mooney Rocket will also be investigated.
The flight testing will be performed by employing the autopilot and
recording the change in altitude versus time.
This data will then be exported to Excel to be used in a Matlab
program. This data will be processed to
determine if the phugoid mode is present.
The
only expenses associated with the project are related to the actual flight
testing. The costs include the aircraft
rental and instructor fees. A proposal
has been made for a second test flight using a Cessna 172 with a 145 horsepower
engine. If this is performed, the cost
of the second flight should be comparable with the first. Table 8 below shows the monetary outlay for
the project.
Table 8 – This table shows
the cost estimates for the project.
|
Test Flight #1
|
$ 472.00
|
|
Proposed Test Flight #2
|
$472.00
|
|
TOTAL
|
$944.00
|
All
simulated flights will be conducted at the WRW Laboratories. As such, these test flights have no out-of-pocket
expense associated with them.
This
project has been separated into three separate phases. Each phase requires completion of the
previous phase in order to be started.
Table 9 highlights the time line of the project.
Phase
one contained three separate parts. This
included the primary investigation into the events and actions that lead to the
two accidents in question. Additionally,
because the phugoid mode is suspected in the Mooney accident, research into
this mode needed to be conducted. This
required learning how to analyze the output data to perceive if the phugoid
mode exists. The final part of phase 1
included the completion of the test models to be used in the X-Plane
software. This phase has been completed.
Phase
two has been split into two areas. Phase
2A was included after the project was started.
This phase involves the actual flight testing of the Cessna 172
aircraft. Phase 2A should be completed
by March 15, 2004.
Phase
2B calls for the simulated flight testing of all vehicles. This includes three series of validation
flights. Once the simulator use has been
verified, the accident recreation can begin.
Phase 2B is set to be completed by April 15.
Phase
3 of the project will involve the final analysis of the data. Included in this will be the completion if
the final report and final recommendations.
This phase is set to be completed by May 5, 2004.
Table 9 – Time line of the
project
|
TASK
|
Completion
|
|
Phase 1
|
February
20, 2004
|
|
Phase 2A
|
March
12, 2004 - PROJECTED
|
|
Phase 2B
|
April
15, 2004 - PROJECTED
|
|
Phase 3
|
May 5,
2004 - PROJECTED
|
Flight
testing is an integral phase of the design process, but testing can be very
expensive. The expenses can be measured
not only in dollars and cents but also in human lives. Flight simulation offers a way to limit
expenses.
Flight
simulators have become better representations of flight in the past
decade. Many pilots, both civilian and
military, use simulators for training and practice. The question still remains, however, if these
simulations are accurate enough to assess possible safety issues and stability
and control concerns.
WiNG
Research is currently trying to answer this question. Flight testing has already been conducted in
actual aircraft to be used for comparison in the flight simulations. These flight simulation tests shall occur
within the next week. WiNG Research will
continue this work for several weeks. A
final report on this topic will be available in early May.
1. Garmin Ltd. Home
Web Page, “Garmin G1000,” URL: http://www.buygarmin.com/products/g1000/
[cited 5 March 2004].
2. Aircraft Shopper
Online (Consumer Web Page), “1958 Cessna 172,” URL: http://www.aso.com/i.aso/AircraftView.jsp?aircraft_id=79716
[cited 5 March 2004].
3. Norman, Donald A., the Design of Everyday Things, Basic
Books, New York,
2002.
4. National
Transportation Safety Board, “LAX98FA154,”
URL: http://www.ntsb.gov/ntsb/brief.asp?ev_id=20001211X10119&key=1 [cited March 4, 2004].
5. Stearman, Ronald,
“Opinion Statements Concerning the Impact of the Rocket 305 Conversion on the
Donald T. Michael Accident near Bakersfield, California on May 5,1998,”
undated.
6. Rocket Engineering
Home Web Page, “Specifications,” URL: http://www.rocketengineering.com/rock_spec.html
[cited 5 March 2004].
7. Nelson Robert C., Flight Stability and Automatic Control,
WCB McGraw-Hill, St. Louis,
Missouri, 1998.
8. Hull,
David G., “Introduction to Airplane Flight Mechanics,” Department of Aerospace
Engineering and Engineering Mechanics, The
University of Texas
at Austin,
Austin,
Texas, Spring 2003.
9. National
Transportation Safety Board, “ATL00FA079,” URL: http://www.ntsb.gov/ntsb/brief2.asp?ev_id=20001212x21645&ntsbno=atl00fa079&akey=1
[cited March 4, 2004].
10. Cessna Aircraft Company, “Cessna Model 172 and Skyhawk Owner’s Manual,”
Wichita,
Kansas,
1984.
11.
Peachtree City
–Falcon Field Airport Information Web Page, “Airport Information,” URL: http://www.kffc.org/airport.htm [cited 5 March 2004].
12. The Pilot and FBO Flight Planning Guide –
AOPA’s Airport Directory, 2001 – 2002 edition,
2001, pp. 3-140, 3-504.
13. Cessna Aircraft
Company, “Cessna 1978 Skyhawk: Cessna
Model 172N – Pilot’s Operating Handbook,” Cessna,
Wichita, Kansas,
1977, pp. inner cover.
14. Smith, H.C.
“Skip,” The Illustrated Guide to
Aerodynamics, 2nd edition, McGraw-Hill, New York, 1992, pp.
120-121.
15. TheBeltsBro.,
Inc., “Description,” X-Plane, http://www.x-plane.com/descrip.html [cited
March 4, 2004].
Below is shown the aircraft weight and balance on the Cessna
172N aircraft that was used for Flight Test SP4-E101.

Figure 7 – Weights and Balance sheet for Cessna
N739ZY
Appendix 2 –
Flight Test Number Designation
This appendix provides for the flight test numbering that
has been used in this report. This
numbering scheme should be used for any future flight tests.
Characters 1 and 2 –These
two characters identify the session in which the test was performed.
SP
– 463Q Spring session
SU
– 463Q Summer Session
FA
– 463Q Fall Session
Character 3 –
This digit represents the year in which the test was conducted.
4
– 2004
5
– 2005
6
– 2006
7
– 2007
8
– 2008
9
– 2009
Character 4 –
This character follows the dash. The
character identifies the aircraft used in the flight test.
A
– Mooney Rocket 305
B
– Cessna 172 SP
C
– Cessna 172 SP – modified for X-Plane to include 40 degree flaps
D
– Cessna 172 H
E
– Cessna 172 N
F
– Cessna 172 E
Character 5 –
This character describes the test flight.
1
– Flight performed in an actual aircraft
2
– Flight performed in a simulator
Characters 6 and 7
– These characters represent the sequence number of the flight. The sequence numbers all start will 01. For instance the first test flight of the
Mooney will start 01 and the first test flight of the Cessna 172 SP will be 01.
01
– First test flight
02
– Second test flight
03
– Third test flight
Example: SP4-E101
This means
that the flight test was performed by the 463Q class during the Spring session. The
test was conducted in 2004. The aircraft
used in the flight was a Cessna 172 N aircraft.
The test was performed under actual flight conditions. The flight was the first test flight
conducted.
Appendix 3 –
SP4-E101 Flight Data
The following pages contain copies of the actual recorded
data for Test Flight SP4-E101.

Figure 8– This shows the weather readings recorded
from AWOS.

Figure 9 – This is data
recorded at the 2100 pounds and 2000 feet agl.

Figure 10 – This is data recorded
at the 2100 pounds and 3000 feet agl.

Figure 11 – This is data
recorded at the 2200+ pounds and 2000 feet agl.

Figure 12 – This is data
recorded at the 2200+ pounds and 3000 feet agl.